5.8. Browsing the data table 
Log into the platform and open a workflow that has data in the table. Click in the Table link at the top of the screen to see the stored data:
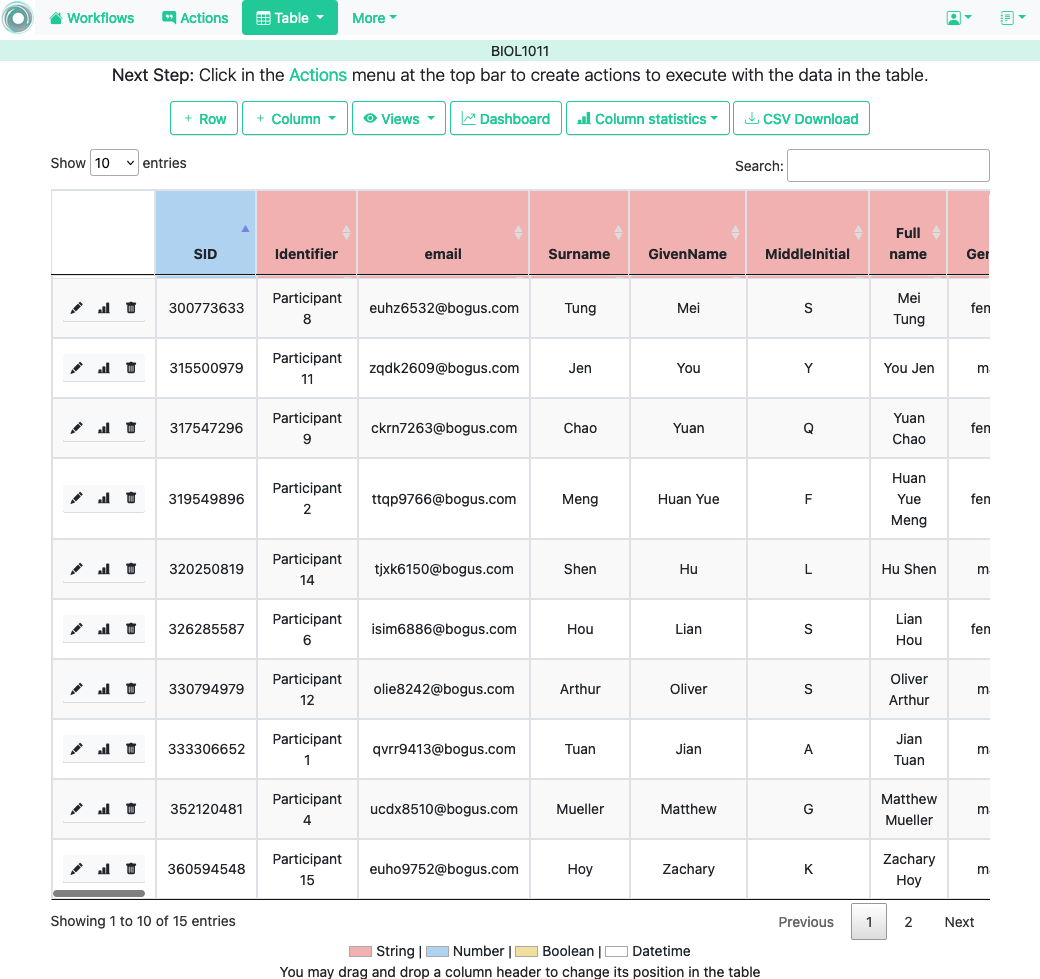
The buttons at the top of the page offer the following functions:

- Row
-
A form to introduce a new row in the table with one field per column.
- Column
-
Add a new column to the table. The pull-down menu also allows to add a column with values calculated with a formula and using the existing values, or a column with random values.
- Views
-
A view is a screen showing a subset of rows and/or columns in the table. Clicking in the Views shows options to create a new view, show the data in a view, or go back to the full table view.
- Dashboard
-
The dashboard shows a statistical summary for the columns shown in the table. This number may be too high, so you should consider using table views to reduce the amount of information shown in the dashboard.
- Column statistics
-
This button allows to choose a non-key column and show an statistic summary of its values
- CSV Download
-
This functionality downloads the data in the table as a CSV file. Combine this functionality with the table views to handle large tables.
- Action with filter
-
Create an action using the restriction in the number of rows as the filter. This option is only available if the view has defined a filter condition.
5.8.1. Table Views 
For tables with a large number of columns and/or rows OnTask allows you to define a view of the table that shows only a subset of it. To create a view click first in the Views button at the top of the table page and then the Add View in the next page. Insert a name, description and select some of the columns as shown in the following figure.
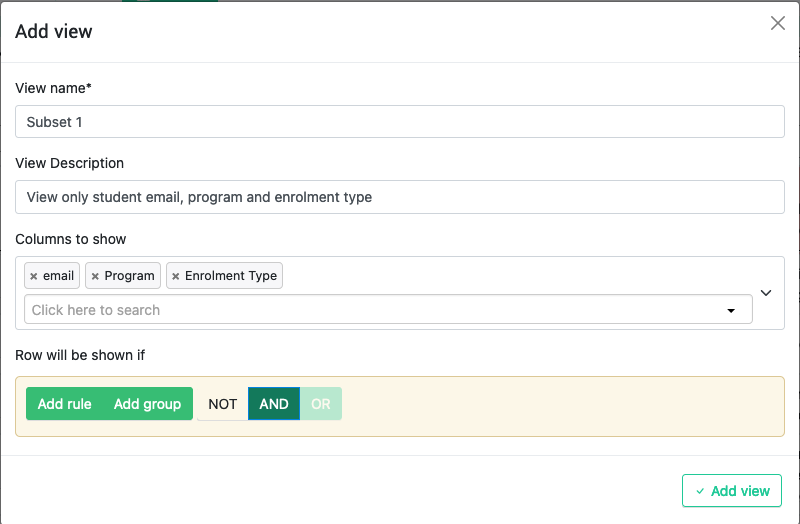
You can also define views to show only a subset of rows. The subset is selected using a row filter stating the conditions that must be satisfied by a row to be included in the view. These conditions are stated in terms of the column values.
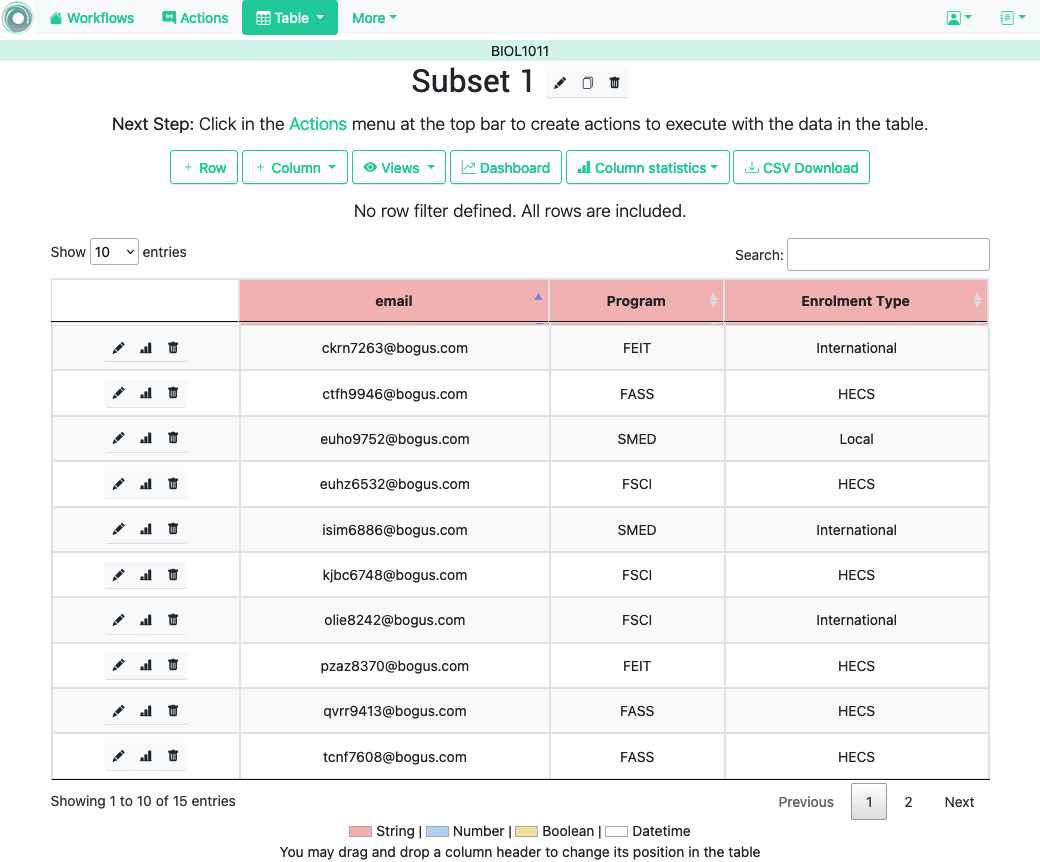
Save the view and then click on the View button. The appropriate table subset is shown. The buttons at the top of the page allow you to edit the view (change the rows and columns selected), or select another available view.
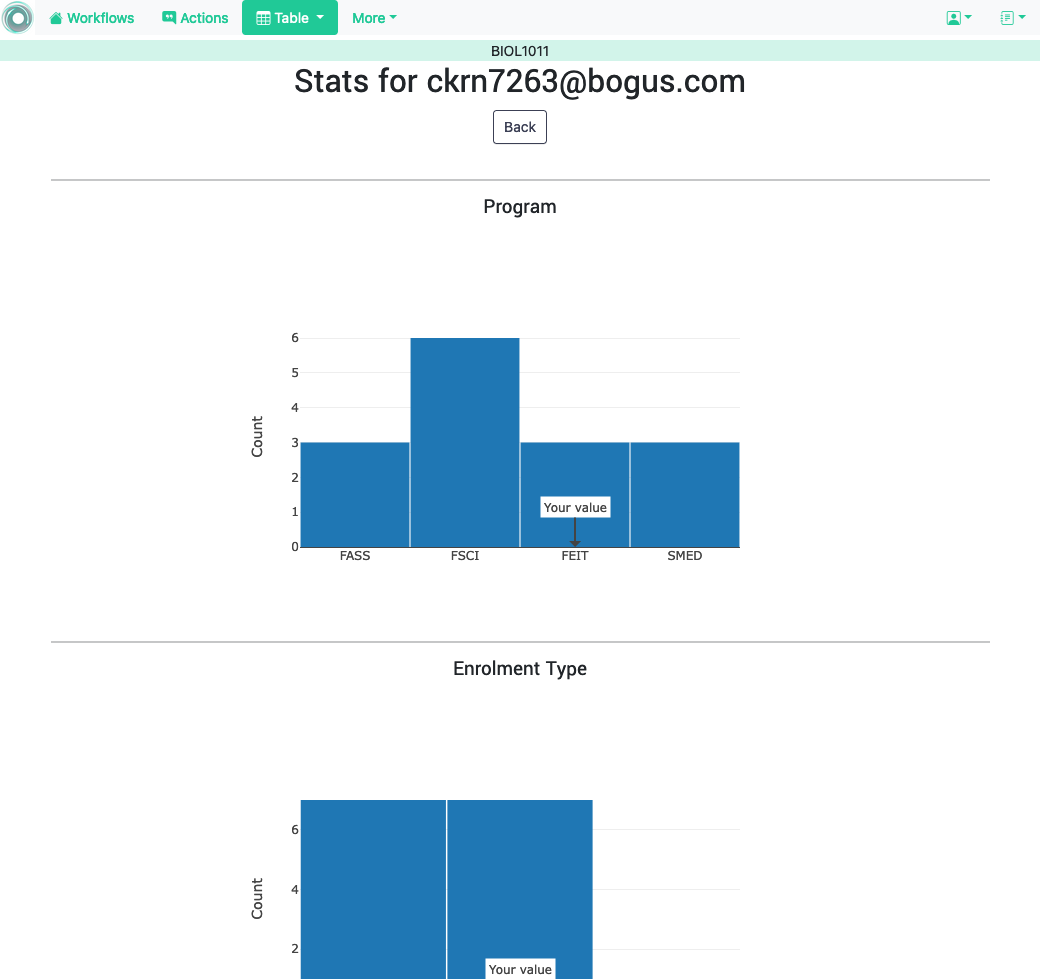
5.8.2. Column and Row Statistics 
If you click on one of the Statistics icons in the left-most column of a row OnTask shows a page with statistical representation of the population values for the columns and a mark denoting where is the value of the selected row.